Data to insights
in minutes
Designed to transform raw data into actionable
insights for faster decisions
Pankaj
Mariya
Div
You

Supported by Industry-Leading Data Analytics Partners.
ChartJS
Cognos
D3.js
Looker
Microstrategy
Plotly
PowerBI
Qlik
Sisense
Tableu
Query your data your way
Streamline your data analysis with our seamless SQL and visual editor.
Give everyone in your team the superpowers they need.
Give everyone in your team the superpowers they need.
SQL
Preview
SQL
Format
1 SELECT city, COUNT(*) AS num_orders
2 FROM orders
3 GROUP BY city
4 ORDER BY num_orders DESC
5 LIMIT 100;
2 FROM orders
3 GROUP BY city
4 ORDER BY num_orders DESC
5 LIMIT 100;
Data in view
Visualize data
with powerfull charts
Visualize your data in a variety of ways thanks to a robust set of visualizations.
Whether it&apso;s as a table, a chart, or a single value — you're in control.
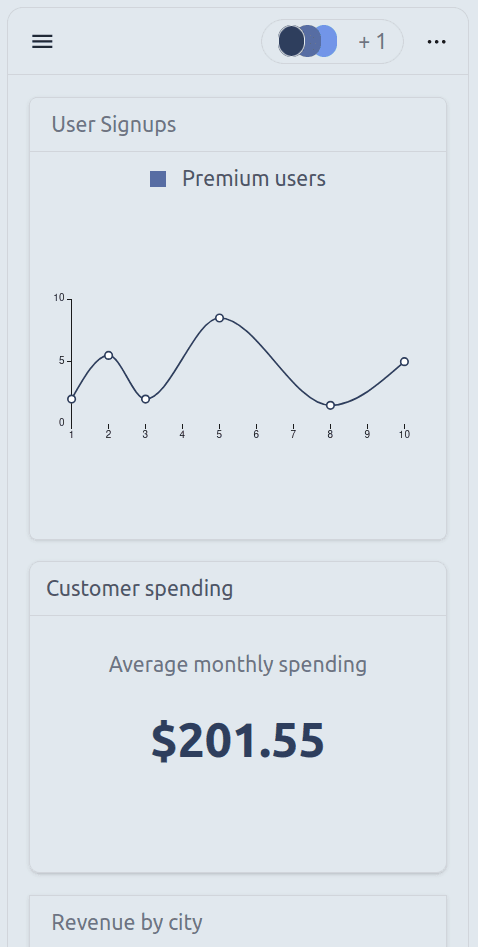
User Signups
Premium users
Numbers of order by cities
Revenue by city
Premium users
Customer spending
Average monthly spending
$201.55
20.5%
Flexibility built-in
Powerful out of the box
Index is build from grouond up to be fast, powerful and delightful to use.
If "Monday, 9 AM"
And "Count on user subscrption' > 10,000
Then "Send Slack message"

Index9:01 AM
Good news to kickstart your week. User subscriptions on this line chart have crossed the 10,000 mark. This is 12% higher than last week. Cheers to more!
Robust alerting (Coming Soon)
Whether you need to schedule recurrent alerts or define advanced conditions, you can build it on Index.
Query #912
3s ago
Loading...
Query #911
3:16s80 words1d ago
SELECT city, SUM(order_value AS total)
FROM orders
WHERE order_date >= '2023-01-01'
AND order_date <= NOW()
Query #910
1:24s92 words3d ago
SELECT user_plan, COUNT(*) AS user_count
FROM user_table
WHERE user_type <> 'anonymous'
AND join_date <= '2023-01-01'
Workspace datasets
Build datasets that anyone in your team can use to ensure easy adoption and consistency.
32
40
16
40
52
44
Premium
Free
Churned
Bar orientation Horizontal
Show values on graph
Advanced customization
Take control of your visualization with powerful customizations options to match your unique needs.
Trust & Safety
Built from day one with a privacy-focused design and compliant approach to securing your data.
Remarkable search
Search on index is remarkably fast and relevant across tables, queries, datasets, and dashboards.
Supercart
Online
Offline Mode. Your changes will be synced once your connection is restored.
Pankaj
Mariya
Div
You
Offline Support
Keep doing you analysis anywhere you are. Everything will sync back when you come online.
Effortless workflows
Every action at your fingertips
Stay flow and improve your workflow with our command bar, providing easy
access to all features through just a few keystrokes.
Invite to board
Rename board
Change theme: Dark
Command bar
Invite to board
Archive board
Create block
Duplicate block
Coming soon
Create block
Copy board link
Change Chart Type
Go to board
Contact support
